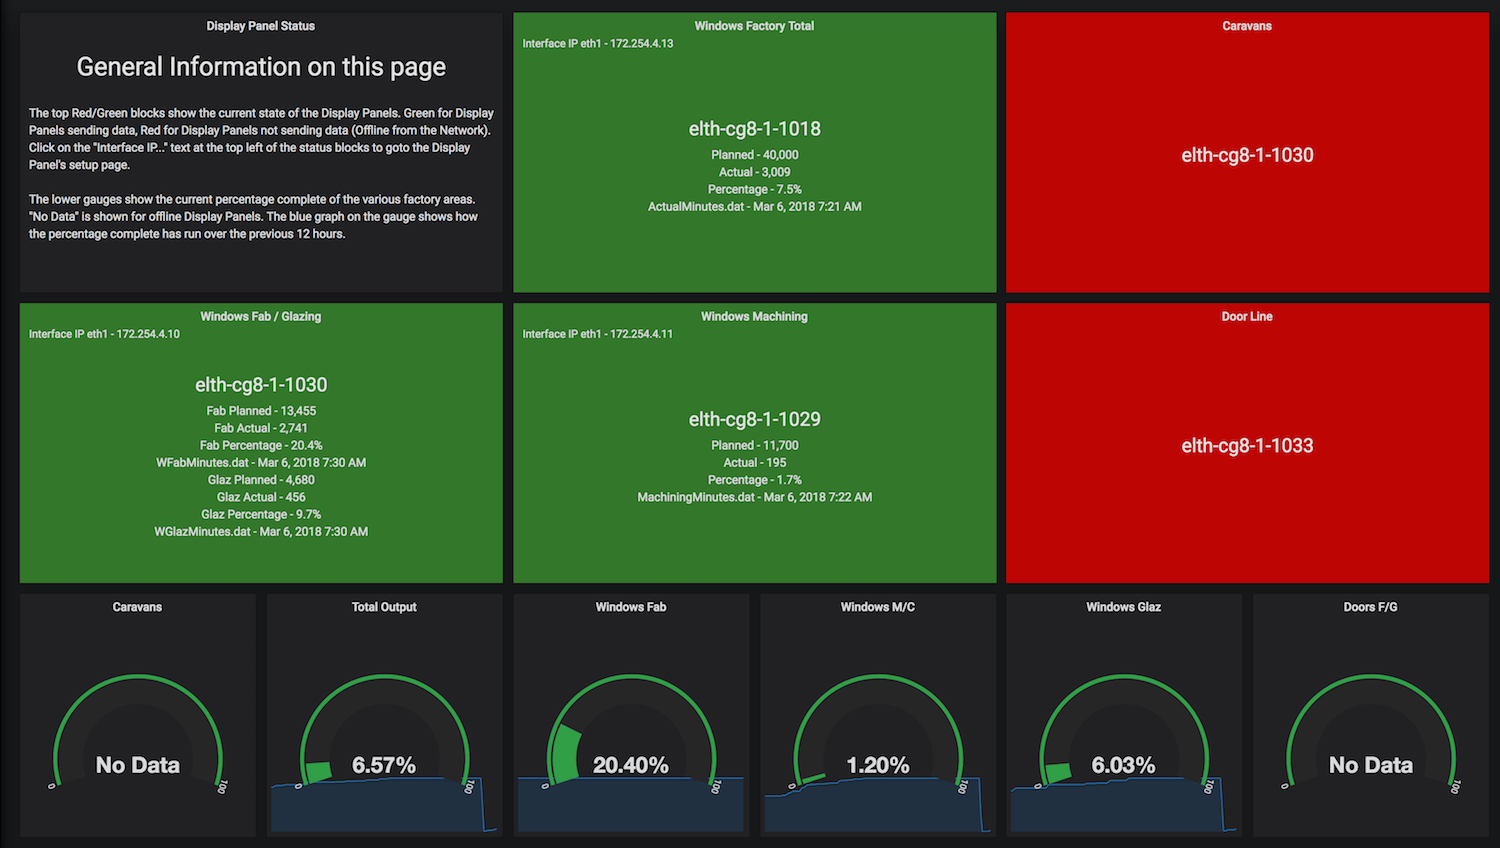
Grafana Dashboard using Zabbix data
We have enhanced the monitoring we are using to show the current state of a local manufacturing production line by using a Grafana Dashboard. A number of displays are situated around the production line facility which show the current plan and actual production at the current moment. Data is fed to the screens in real time and Zabbix is used to monitor the display's network status and to capture the current displayed data, this is then displayed in a single Grafana Dashboard.

