IoT Electric Imp monitoring with Zabbix and Grafana - Part 2
 The Electric Imp range of IoT devices offer a simple means to interface with a number of different physical data collection devices and connect back to a central controlling Server Platform via built-in WiFi. Code can be written and deployed from the central Server Platform that controls how the collected data is made available.

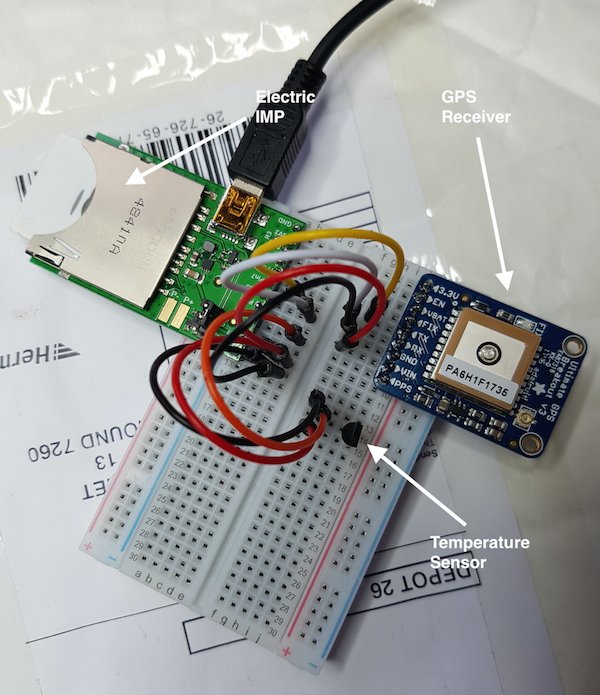
My original article on the Imp was based on a simple implementation that just used the internal light sensor in an Electric Imp passing back data via Cloud Servers to Zabbix and visualising on a Grafana Dashboard. Using the same infrastructure of the Imp, the central Cloud Servers, Zabbix and Grafana, I extended the data collection capabilities by adding a temperature sensor and GPS receiver.

Interestingly, when you put all this together there are no external electronic components as it's all constructed from the Imp itself and the sensors which are just wired together. In the above picture this is done using a "Breadboard" with fly leads but this could easily be constructed in a case with battery power.
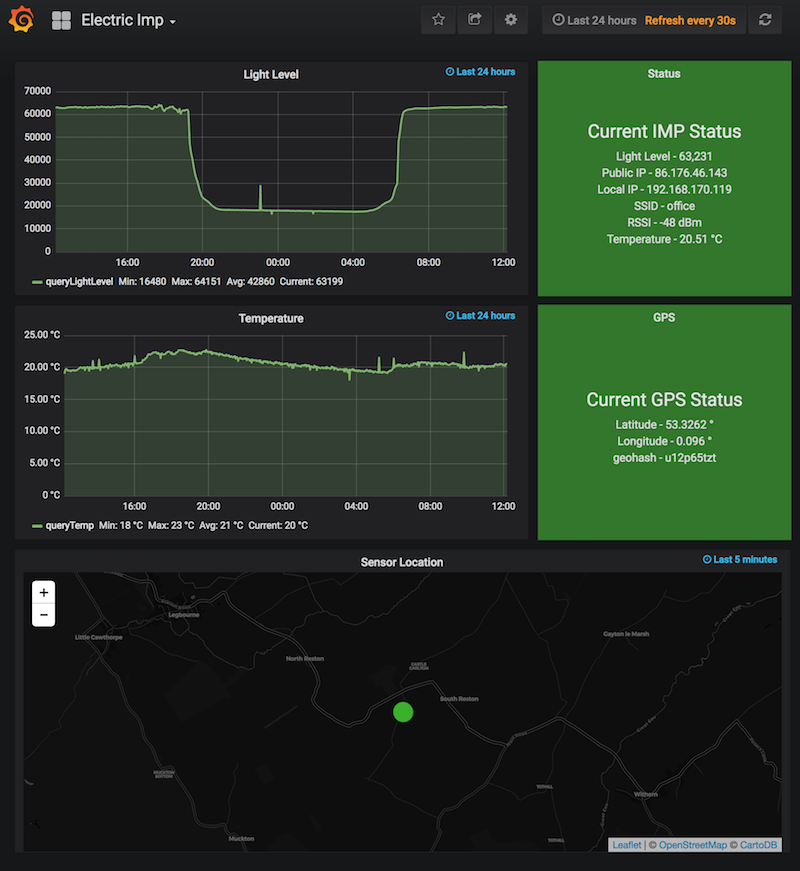
The Grafana Dashboard was also extended to show the temperature and GPS data. The position from the GPS receiver is also showed on a map.

